IS THE EU HEADED FOR A FALL?
- MSE Research Cell

- Mar 6, 2018
- 9 min read
BY: Rana Sundram & Sonal Barve | Winners Dr. Gadgil Memorial Paper Presentation
ABSTRACT
This paper studies the business cycles of 20 European countries from 2000:Q1 to 2015:Q1. The Hodrick-Prescott filter is used to extract business cycles from real GDP data. A correlation matrix of European business cycles is obtained. The Bry and Boschan algorithm is implemented to check the lead or lag of an individual country‟s business cycle with respect to the combined Eurozone business cycle. These methods tell us which countries are synchronized and which are not. Finally, the Vector Auto Regression model helps us check passthrough of shocks from the rest of the Europe into any individual country. The Impulse Response graphs reveal that shocks to the rest of Eurozone passthrough into highly synchronized countries such as Germany and France. No such pass-through was observed for Greece. We find that certain countries, especially Greece, that were hardest hit by the European debt crisis, have fallen out of sync since the financial crisis. These results suggest that the prospect of more EU countries giving up monetary autonomy to adopt the common currency is a risky one. This leaves the future of the EU highly uncertain.
Introduction
This paper examines the effectiveness of the European Union, as formally established by the Maastricht Treaty of 1992. Since its inception, the EU has centred on the single market. According to the Maastricht Treaty, all EU member states are obliged to adopt the Euro as their sole currency once they meet the Euro Convergence criteria and enter the third stage of the Economic and Monetary Union (EMU). Currently, 19 member states, collectively called the Eurozone, use euro as their common currency. Enlargement of the Eurozone is indeed an on-going process within the EU, the latest addition being Lithuania in 2015. Evaluating the outcome of such a monetary union is very important, and is the motivation for our current investigation. The introduction of the euro gave rise to significant literature advocating synchronisation of economic activity to set the stage for common monetary policy (de Haan et al, 2007). Mundell (1961) states that the benefits of common currency outweigh the cost of monetary autonomy only when all participants in the region have similar business cycles, allowing economic booms to be shared, and a single monetary policy to counterbalance and diffuse economic recessions. Since then, a certain degree of synchronicity is often regarded as a prerequisite for monetary policy to satisfy the needs of all member countries. The data for our study are the business cycles of 20 European countries, namely, Austria, Belgium, Bulgaria, Croatia, Czech Republic, Estonia, Finland, France, Germany, Greece, Hungary, Ireland, Italy, Luxembourg, Netherlands, Poland, Portugal, Romania, Slovenia and Spain. The time period concerned ranges from 1999:Q1 to 2015:Q1. All data has been retrieved from the St. Louis Federal Reserve website, https://fred.stlouisfed.org/
Measuring Business Cycles and Synchronization
In this section we describe our procedure to obtain business cycles from raw data in order to be able to measure the „synchronization‟ between them. We collect quarterly, seasonally adjusted real GDP data for all 20 countries. We then employ the Hodrick–Prescott filter to remove the cyclical component from log-linearised actual output. This filter decomposes yt, into a trend component, τt and a cyclical component, ct such that,
yt = τt + ct .
For an appropriate value of λ, the filter finds values of time series τt that minimises: (∑ (yt - τt ) 2 + λ∑ [( τt+1 - τt ) – (τt - τt -1)]2 )
Here, λ is a smoothing parameter that is set at 1600 for quarterly data and is used to penalize the variance in growth trend. Higher the value of lambda, higher is the penalty for variance in growth trend. When lambda is set to zero we are essentially plotting a linear regression line through the data. When lambda is set to infinite, the variance of the cyclical component is zero and all the variation in actual output is explained by movements in the trend. These cyclical components are not „true‟ values of the business cycle. They are only our estimates of the „true‟ values. The accuracy of such estimates ultimately depend on the appropriateness of the instrument. The Hodrick Prescott filter has many issues with it, but it can be considered a better approximation than simple linear detrending which postulates that the economy has a deterministic growth rate. Once obtained these cycles can be used in a variety of ways. In this paper they are only used to study the phenomenon of sychronization. For this purpose, we will study correlations between individual cycles and that of the „aggregate‟ European business cycle. We will also study inter-country cycle correlations. The Bry and Boschan Algorithm as well as the VAR model will be applied on these cycles. These estimates therefore form the basis of our study, and all results therefore depend on the accuracy of these estimates. The following figures show a few examples of business cycles filtered from real GDP data.

Figure 1. Aggregate business cycle for 20 European countries

Figure 2. Business cycle of Germany
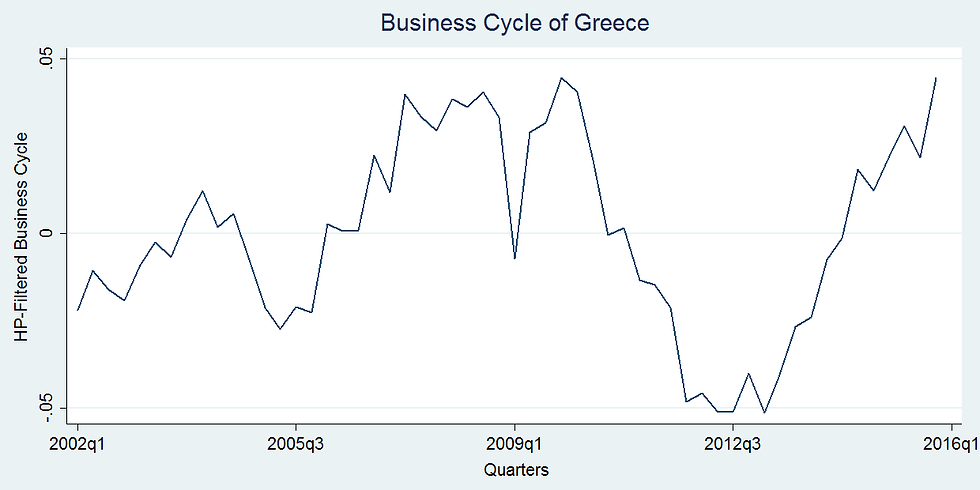
Figure 3. Business cycle of Greece
We observe that there are dissimilarities in the business cycles of different countries. We study syncronization of business cycles by means of the correlation matrix.
Table 1. Correlation Matrix of Business Cycles of all 20 European countries
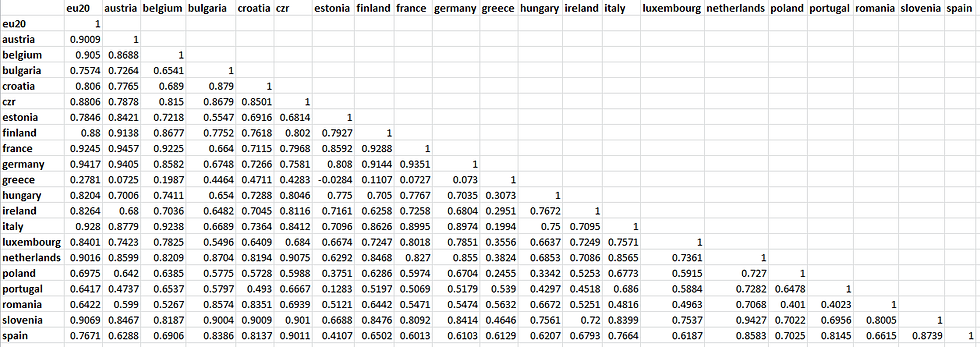
Estonia, Spain, Bulgaria, Poland, Romania, Portugal, and Greece have below average
synchronisation with the aggregate European business cycle. While Germany, France, Italy, Belgium, Netherlands, Austria and Luxembourg are highly synchronized. It is imperative to note that Greece has an extremely poor synchronization. Further, while large economies like Germany and France are highly synchronized, there are some smaller economies like Luxembourg that are also equally synchronized. A large economy can also be less synchronized, such as Spain. Therefore at first glance, size does not seem to influence the level of synchronization.
3. Dating the Turning Points
Countries experience alternating periods of expansion and contraction as they grow, which are marked by turning points: peaks and troughs. It is possible to better understand the characteristics of a business cycle by studying its turning points. In this section, we use the Bry and Boschan algorithm that dates business cycle turning points using a set of simple rules. These rules are based on the NBER turning points detection method and are stated as under:
1. Peaks and Troughs must alternate.
2. Each phase (from peak to trough or trough to peak) must have a duration of at least
six months.
3. A cycle (from Peak to Peak or from Trough to Trough) must have a duration of at
least 15 months.
4. Turning points within six months of the beginning or end of the series are
eliminated as are peaks or troughs within 24 months of the beginning or end of the
series if any of the points after or before are higher (or lower) than the peak (trough).
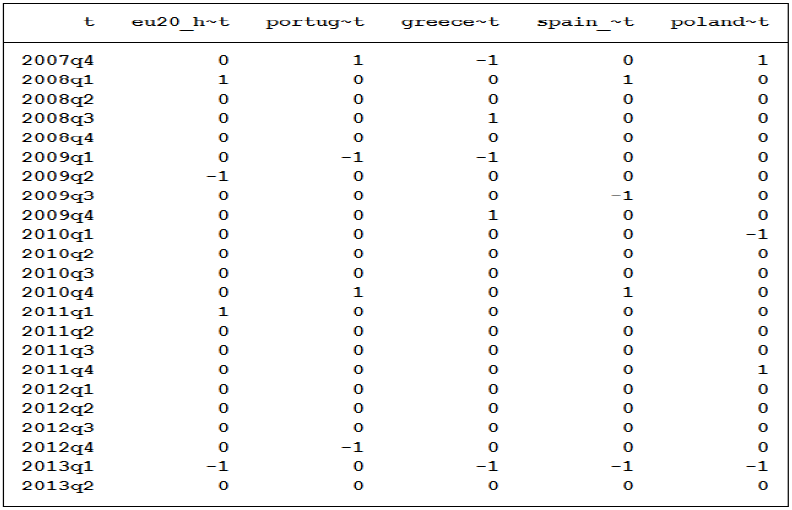
For each time series this algorithm generates another time series filled with „0‟, „1‟ or „-1‟.
Peaks are denoted by „1‟ and troughs, by „-1‟. In practise, we apply the Harding and Pagan (2002) BBQ algorithm which is a quarterly version of the Bry and Boschan method. We note that during the years around the financial crisis, it was countries like Germany, France, Italy, Belgium, Netherlands and Luxemburg that were in phase with the European business cycle. Whereas countries like Portugal, Greece, Spain and Poland were out of phase.
Table 2 lists a comparison of turning points of business cycles of the most synchronous countries with respect to the turning points of the aggregate European business cycle. Table 3 lists the same for some of the least synchronous countries in Europe.
Table 2. Turning Points Detection (L-R): Europe, Germany, France, Italy, Belgium, Netherlands, Luxembourg

Table 3. Turning Points Detection (L-R): Europe, Portugal, Greece, Spain, Poland
Vector Auto Regression Model
The Vector Auto Regression (VAR) Model is a stochastic model that is used to capture linear inter-dependencies amongst multiple time series. Each variable in a VAR has an equation explaining its evolution based on its own lagged values, the lagged values of the other model variables, and an error term.
Consider a simple bivariate system:
yt = b10 – b12zt + γ11yt -1 + γ12zt -1 + εyt
zt = b20 – b21yt + γ21yt -1 + γ22zt -1 + εzt
It is assumed that both yt and zt are stationary. εyt and εzt are uncorrelated white noise disturbances with standard deviation of σy and σz respectively. These equations are known as the Primitive System or Structural VAR.
Above mentioned equations incorporate the feedback because yt and zt are allowed to affect each other. Such a system can help us capture the feedback effects in our business cycle synchronization model as to how the effect of a shock in a country, for instance, Greece, affects the rest of the EU and how a shock to the EU gets transferred to Greece.
The variables to be included in the VAR are selected according to the relevant economics model. Here, our modelling strategy is to link the „Business Cycles of Country X‟ with the „Business Cycles of Europe without Country X‟. So we take the business cycle of X as one variable and the business cycle of rest of the EU as the other variable in order to check for the effect of a shock to that country in the rest of the EU. Appropriate lag lengths are selected using the AIC criteria.
Identification is a major issue. And in order to attain complete identification we set b12 and b21 to zero. This implicitly implies that we conjecture that the interdependencies of the two time series only takes place with a lag and not contemporaneously.
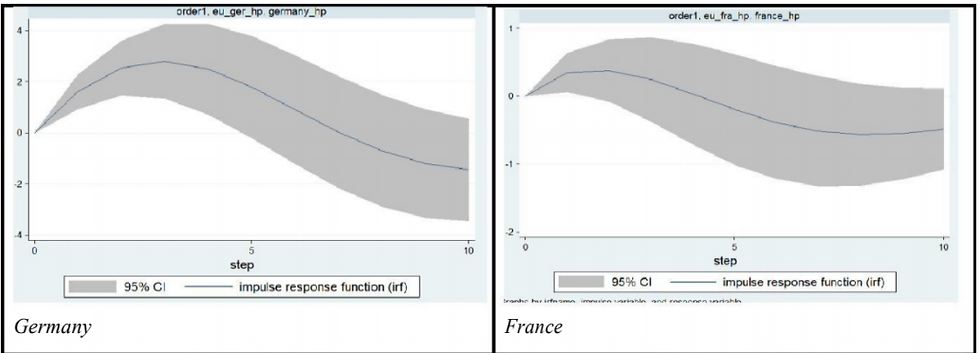
How the yt and zt series behave due to various shocks is captured graphically by the Impulse Response Function. An impulse response function tells us how a one-off shock to one series passes through into the other. It tells us how long its effect will persist, and how long it will take to decay before the series reverts to its mean. 95% Confidence Interval (CI) around impulse responses allows for the parameter uncertainty inherent in the estimation process.
Since stationarity is an assumption underlying many statistical procedures used in time series analysis, we first conduct a Dickey-Fuller test to test the null hypothesis of whether a unit root is present. Table 4 lists our results:
Table 4. Dickey-Fuller test for Stationary Process

We note that except Greece and Ireland, all other countries show a test statistic greater than the 5% level of significance. Hence, we reject the null hypothesis and conclude that these countries have stationary business cycles. As for anomalous results for Greece and Ireland, we believe one reason for this could be that these nations must be having a much more volatile trend than what the HP filter detects, hence giving rise to the observed non-stationarity. We proceed with our analysis assuming these countries to have stationary business cycles as well.
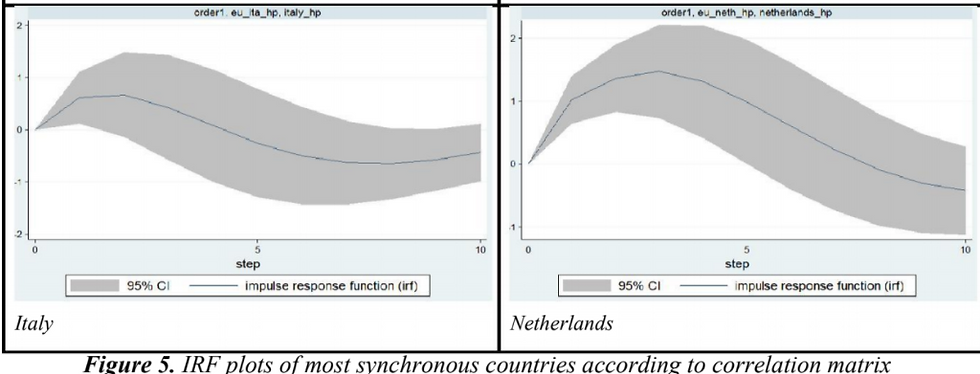
Now we implement our VAR model and look at the IRF plots to see whether shocks to the "Business Cycles of Europe without Country X" pass through into the "Business Cycles of Country X". If there is pass-through, then country X is said to be synchronized.
We observe that Greece, Poland, Portugal, Spain (Figure 6) have their CIs never lift off from zero. Thus they do not show significant pass-through of shocks that hit the rest of Europe. However, the top most synchronous countries of Europe (Figure 7) have entire CIs above 0 at some point. This implies that the impact of the shock to the rest of Europe is passed through to each of these countries. There is, however, a few quarters lag in transmission.
Conclusion
The financial crisis of 2007-2008 and its resulting consequences on government debt levels forced central banks worldwide to implement unconventional monetary policy to avoid an economic breakdown. This crisis also further contributed to the European sovereign debt crisis which began at the end of 2009 and continues till today. In the case of the Eurozone, this has been particularly challenging because a single monetary policy is applied to a large set of countries that are in different phases of their respective business cycles.
Our paper evaluates the synchronisation of business cycles of 20 European countries in the light of these historical events. Our key findings from the three approaches discussed in this paper are:
1. Countries such as Germany, France, Italy, Belgium, Netherlands, and Austria with
similar economic growth have strongly synchronous business cycles.
2. Spain and Portugal, followed by Poland and Romania which have had weaker
economic performance are weakly synchronized with the rest of Europe.
3. Greece is the least synchronized nation and ought to be out of the Eurozone by
Mundell‟s standards.
4. The divide between these core and peripheral countries deepened further in the years around 2007-2009 when the former survived the financial and debt crises and stayed in sync but the latter fell out of synchronization with the rest of Europe.
The Maastricht Treaty, which brought the European Union into being, also set off the process of adopting the common euro currency. However, structural asymmetry in individual countries has resulted in asymmetry in their business cycles as well. This poses a serious threat to the "one-size-fits-all" monetary policy of the European Central Bank. Thus, the political and economic project of the European Union is at great risk unless it integrates its member economies more fully in the near future.
References
1. Robert A. Mundell, “A Theory of Optimum Currency Areas”, The American
Economic Review, Vol. 51, No. 4, pp. 657-665, September 1961.
2. Jeffrey A. Frankel & Andrew K. Rose, “The Endogenity of the Optimum Currency
Area Criteria”, National Bureau of Economic Research, August 1996.
3. Jakob de Haan, R Inklaar, R Jong‐A‐Pin, “Will Business Cycles in the Euro Area
Converge? A Critical Survey of Empirical Research”, Journal of Economic Surveys
22 (2), 234-273, December 2007.
4. All empirical analysis done using Stata statistical software package.


Comments